- Page 1
- Page 2
- Page 3
- Page 4
- Page 5
- Page 6
- Page 7
- Page 8
- Page 9
- Page 10
- Page 11
- Page 12
- Page 13
- Page 14
- Page 15
- Page 16
- Page 17
- Page 18
- Page 19
- Page 20
- Page 21
- Page 22
- Page 23
- Page 24
- Page 25
- Page 26
- Page 27
- Page 28
- Page 29
- Page 30
- Page 31
- Page 32
- Page 33
- Page 34
- Page 35
- Page 36
- Page 37
- Page 38
- Page 39
- Page 40
- Page 41
- Page 42
- Page 43
- Page 44
- Page 45
- Page 46
- Page 47
- Page 48
- Page 49
- Page 50
- Page 51
- Page 52
- Page 53
- Page 54
- Page 55
- Page 56
- Page 57
- Page 58
- Page 59
- Page 60
- Page 61
- Page 62
- Page 63
- Page 64
- Page 65
- Page 66
- Page 67
- Page 68
- Page 69
- Page 70
- Page 71
- Page 72
- Page 73
- Page 74
- Page 75
- Page 76
- Page 77
- Page 78
- Page 79
- Page 80
- Page 81
- Page 82
- Page 83
- Page 84
- Page 85
- Page 86
- Page 87
- Page 88
- Page 89
- Page 90
- Page 91
- Page 92
- Page 93
- Page 94
- Page 95
- Page 96
- Page 97
- Page 98
- Page 99
- Page 100
- Page 101
- Page 102
- Page 103
- Page 104
- Page 105
- Page 106
- Page 107
- Page 108
- Page 109
- Page 110
- Page 111
- Page 112
- Page 113
- Page 114
- Page 115
- Page 116
- Page 117
- Page 118
- Page 119
- Page 120
- Page 121
- Page 122
- Page 123
- Page 124
- Page 125
- Page 126
- Page 127
- Page 128
- Page 129
- Page 130
- Page 131
- Page 132
- Page 133
- Page 134
- Page 135
- Page 136
- Page 137
- Page 138
- Page 139
- Page 140
- Page 141
- Page 142
- Page 143
- Page 144
- Page 145
- Page 146
- Page 147
- Page 148
- Page 149
- Page 150
- Page 151
- Page 152
- Page 153
- Page 154
- Page 155
- Page 156
- Page 157
- Page 158
- Page 159
- Page 160
- Page 161
- Page 162
- Page 163
- Page 164
- Page 165
- Page 166
- Page 167
- Page 168
- Page 169
- Page 170
- Page 171
- Page 172
- Page 173
- Page 174
- Page 175
- Page 176
- Page 177
- Page 178
- Page 179
- Page 180
- Page 181
- Page 182
- Page 183
- Page 184
- Page 185
- Page 186
- Page 187
- Page 188
- Page 189
- Page 190
- Page 191
- Page 192
- Page 193
- Page 194
- Page 195
- Page 196
- Page 197
- Page 198
- Page 199
- Page 200
- Page 201
- Page 202
- Page 203
- Page 204
- Page 205
- Page 206
- Page 207
- Page 208
- Page 209
- Page 210
- Page 211
- Page 212
- Page 213
- Page 214
- Page 215
- Page 216
- Page 217
- Page 218
- Page 219
- Page 220
- Flash version
© UniFlip.com
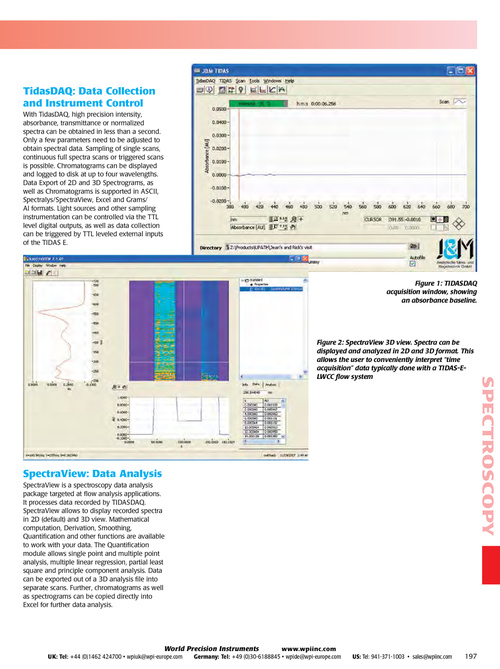
tidasDAQ: Data Collection and instrument Control
With TidasDAQ, high precision intensity, absorbance, transmittance or normalized spectra can be obtained in less than a second. Only a few parameters need to be adjusted to obtain spectral data. Sampling of single scans, continuous full spectra scans or triggered scans is possible. Chromatograms can be displayed and logged to disk at up to four wavelengths. Data Export of 2D and 3D Spectrograms, as well as Chromatograms is supported in ASCII, Spectralys/SpectraView, Excel and Grams/ AI formats. Light sources and other sampling instrumentation can be controlled via the TTL level digital outputs, as well as data collection can be triggered by TTL leveled external inputs of the TIDAS E.
Figure 1: TIDASDAQ acquisition window, showing an absorbance baseline.
Figure 2: SpectraView 3D view. Spectra can be displayed and analyzed in 2D and 3D format. This allows the user to conveniently interpret “time acquisition” data typically done with a TIDAS-ELWCC flow system
SPECTROSCOPY
SpectraView: Data Analysis
SpectraView is a spectroscopy data analysis package targeted at flow analysis applications. It processes data recorded by TIDASDAQ. SpectraView allows to display recorded spectra in 2D (default) and 3D view. Mathematical computation, Derivation, Smoothing, Quantification and other functions are available to work with your data. The Quantification module allows single point and multiple point analysis, multiple linear regression, partial least square and principle component analysis. Data can be exported out of a 3D analysis file into separate scans. Further, chromatograms as well as spectrograms can be copied directly into Excel for further data analysis.
World Precision Instruments
UK: Tel: +44 (0)1462 424700 • wpiuk@wpi-europe.com
www.wpiinc.com Germany: Tel: +49 (0)30-6188845 • wpide@wpi-europe.com
US: Tel: 941-371-1003 • sales@wpiinc.com
197