Most other countries have the problem
much more than we do. But there is another
important issue. Who finishes up dealing with
the problem? In many societies, the brunt of
it falls on the families. In Australia, and the
United States among others, the problem has
been socialised; dealing with the issue has
been transferred to the government.
increase the ageing problem, of course,
except insofar as behavior is changed (people
retire earlier than otherwise and/or
overuse their underpriced healthcare, for
example). I personally have no objection to
the socialisation of the issue, but it probably
increases its visibility.
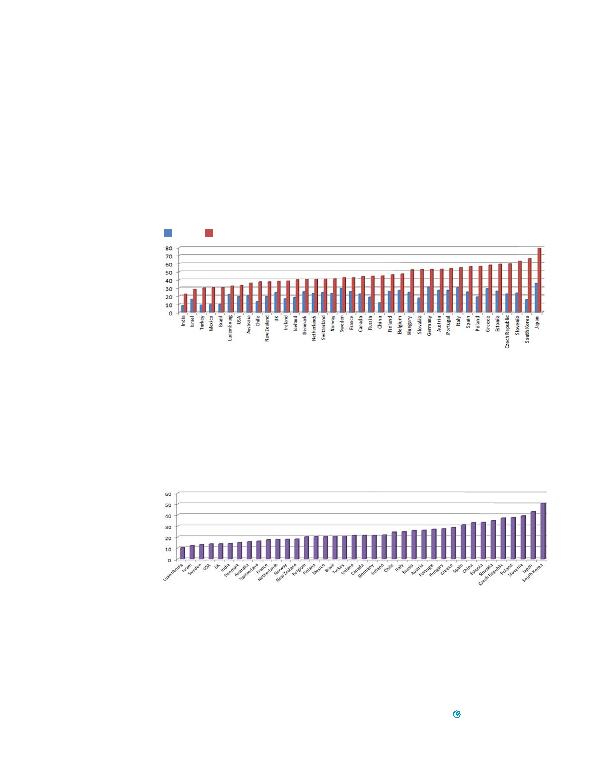
at the ratio between the population 65 and
over (which no longer seems particularly
old to me), and the population of working
age, defined as those aged 15 to 64. The
next chart shows 40 countries ranked by the
40 countries, Australia will be the eighth
youngest in 2050, with Japan
the oldest.
will be in 2050.
getting older. The next chart therefore
shows the likely increase in the aged
dependency ratio between now (actually
2010) and 2050.
common to both sets of charts. And the
country aging most rapidly is South Korea,
which goes from seventh youngest
to second oldest in the 40 years to 2050.
The countries toward the top end of the
scale are, of course, those with low birth
rates and/or little or no immigration.